
The 2026 Australian GP is live. Russell and Leclerc are battling it out, and you want the data on your desk, not a browser tab, not your phone. Something physical that just sits there. You have an ESP32 CYD in the parts drawer: 320×240 touchscreen, built-in Wi-Fi, €10. OpenF1 is free and has real F1 timing data.
This sounds like a fun Sunday afternoon project. It wasn't.
The first problem hits immediately. OpenF1 doesn't return race state, it returns race history. Hit /position and you get thousands of chronological entries, one per position change, every driver, entire session. Hit /laps and you get the same for lap times. /stints for tyres. /intervals for gaps. Six endpoints, all flat arrays, none of them joined, none of them telling you what's happening right now.
The second problem is the ESP32 itself. 320KB of RAM. Fetching and aggregating six endpoints of session data on a microcontroller isn't a performance concern, it's a category error. Micro Python's urequests will run out of memory before it finishes parsing the response.
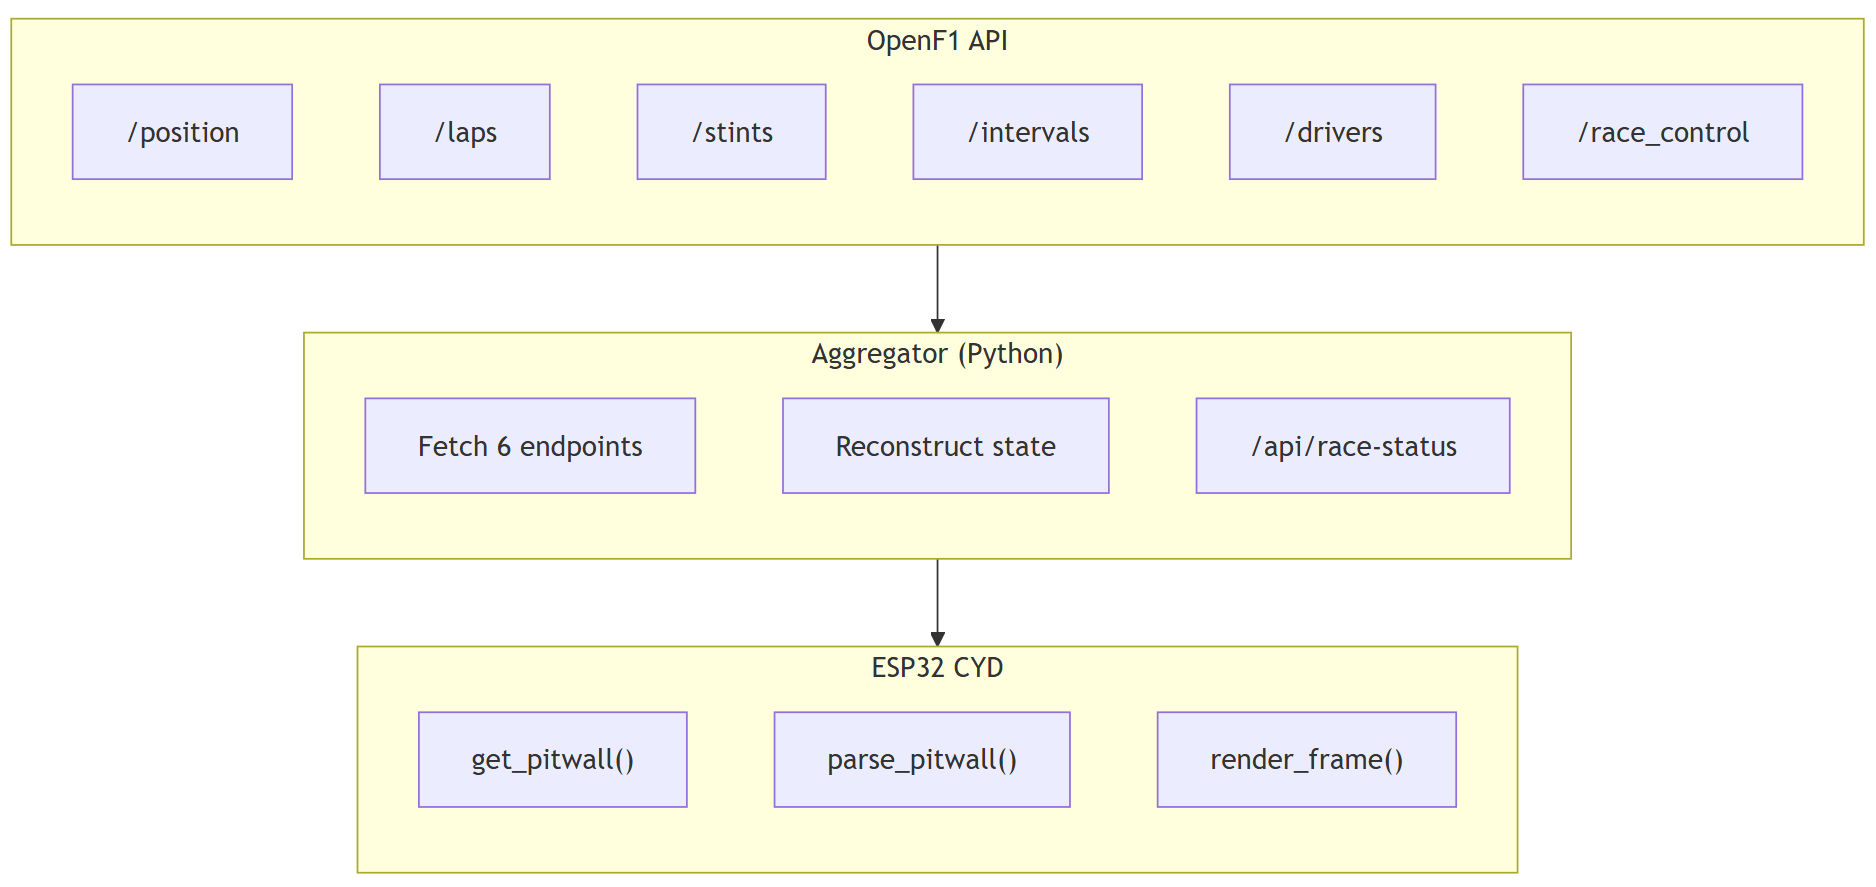
So the fun Sunday afternoon project becomes an exercise of a proper two-layer architecture: a Python aggregator on a local server that reconstructs race state from OpenF1's raw streams and exposes a single clean endpoint, and a Micro Python client that makes one HTTP request, gets back exactly what it needs, and renders it on a $10 screen sitting next to the keyboard.
Here's how it's built.
Full source for the API and CYD display:
One Endpoint, One Request
The first thing to get right is the boundary between server and device.
OpenF1 is the source: free, no API key, real timing data during sessions. Do note that access to live session data requires a paid API key, historical data access is free.
The catch is the shape of that data, the API is a log, not a state machine. It records everything that happened; figuring out what's happening now is your job. So we move that job off the device.
The fix is straightforward once you accept that the ESP32 is a display device, not a data processor.
You move the aggregation off the microcontroller entirely and onto anything with more headroom, like a Raspberry Pi, a spare machine, a Docker container, whatever is already running on your network. That server fetches all six OpenF1 endpoints, reconstructs current race state, and exposes a single endpoint: /api/race-status.
The ESP32 makes one HTTP request. It gets back one JSON response. That response contains exactly what the display needs, positions in order, driver codes, tyre compounds, tyre age in laps, gap to leader, fastest lap, and nothing else. No filtering, no aggregation, no memory pressure.
This is the core architectural decision of the whole build, and it applies well beyond OpenF1.
Any time you're hitting a complex external API from a microcontroller, like weather, sports scores, home automation, or any dashboard, the instinct is to do as much as possible on the device. Resist it.
Microcontrollers are good at talking to hardware; a Python server on your network is good at talking to APIs. Put each where it belongs and the problem gets simpler on both ends. The same aggregator can then serve other clients too: a second display, an e-ink board, a different form factor. One server, many endpoints, many devices.
The split also has a practical benefit: when OpenF1 changes an endpoint or returns unexpected data, you fix it in one file on the server. The display doesn't care where the data came from, only that it arrived in the right shape.
Part 1: The Aggregator
The server's job: turn six OpenF1 streams into one snapshot the display can consume without thinking. The aggregator lives in a race_status.py, in my case served as an API endpoint on a Raspberry Pi.
Positions
/position returns every position change for every driver, thousands of entries. You need the most recent entry per driver, not the last item in the array. Group by driver_number, take the entry with the highest date per group:
def _latest_position_per_driver(positions: list[dict]) -> dict[int, int]:
    """Map driver_number -> position using the most recent update per driver."""
    by_driver: dict[int, list[dict]] = {}
    for p in positions:
        if p.get("date") is None:
            continue
        dn = p["driver_number"]
        if dn not in by_driver:
            by_driver[dn] = []
        by_driver[dn].append(p)
    out = {}
    for dn, updates in by_driver.items():
        if not updates:
            continue
        latest = max(updates, key=lambda x: x["date"])
        out[dn] = latest["position"]
    return out
That pattern, group by entity, take latest, is the same for positions, intervals, and stints. The result is a {driver_number: position} mapping you can sort and iterate.
Tyres
/stints gives compound and lap_start, not tyre age. Sort each driver's stints by lap_start descending, find the stint that covers the current lap (lap_start ≤ now and no lap_end or lap_end ≥ now), then tyre_age = current_lap - lap_start + 1.
Gaps
First choice: /intervals and its gap_to_leader, latest per driver as above. If the endpoint is empty (e.g. early in the session), fall back to lap-time delta: leader's last lap time minus driver's. When a driver is lapped, OpenF1 returns "+1 LAP" as a string, check the type and pass through as-is instead of formatting as seconds.
Formatting and total laps
Lap times and gaps are formatted on the server (e.g. ≥60s → M:SS.mmm, else +N.NNNs) so the display never does number formatting. OpenF1 doesn't expose scheduled race distance; the aggregator leaves total_laps as None and the display shows LAP 24 without a denominator.
The Response
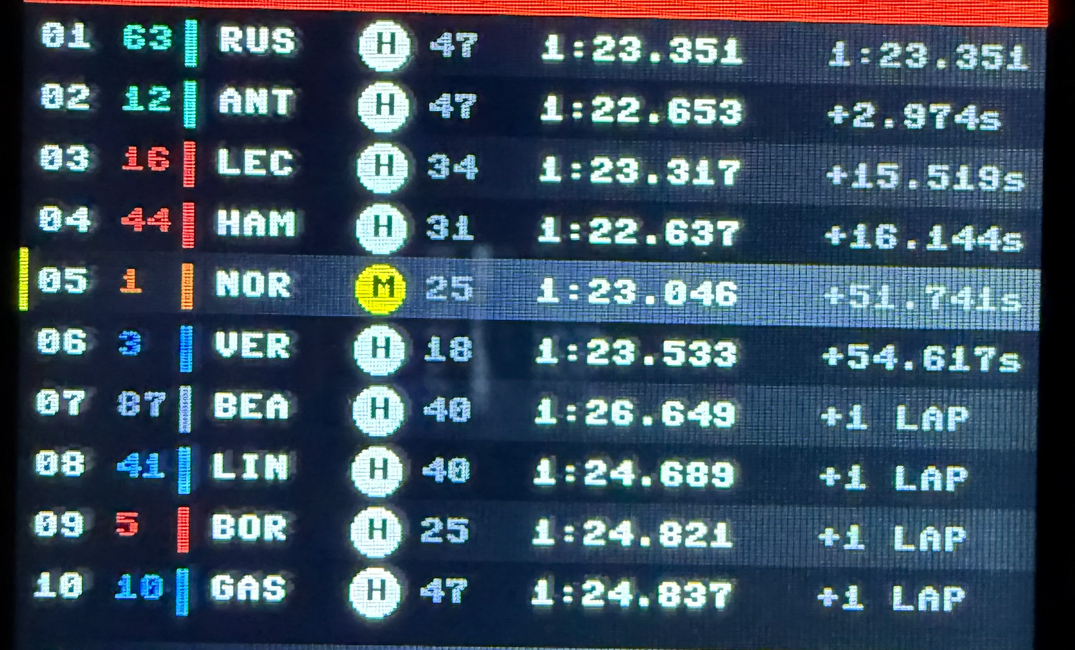
All of that feeds into a single get_race_status() that returns this shape:
{
  "session": {
    "circuit_name": "Melbourne",
    "country_iso3": "AUS"
  },
  "latest_lap_number": 58,
  "total_laps": null,
  "current_standings": [
    {
      "position": 1,
      "driver_number": 63,
      "name": "George RUSSELL",
      "name_acronym": "RUS",
      "team_colour": "00D7B6",
      "tyre": "HARD",
      "stint_duration_laps": 47,
      "lap_time_seconds": 83.351,
      "lap_time": "1:23.351",
      "lap_time_or_gap": "1:23.351"
    },
    {
      "position": 2,
      "driver_number": 12,
      "name": "Kimi ANTONELLI",
      "name_acronym": "ANT",
      "team_colour": "00D7B6",
      "tyre": "HARD",
      "stint_duration_laps": 47,
      "lap_time_seconds": 82.653,
      "lap_time": "1:22.653",
      "lap_time_or_gap": "+2.974s"
    },
    {
      "position": 3,
      "driver_number": 16,
      "name": "Charles LECLERC",
      "name_acronym": "LEC",
      "team_colour": "ED1131",
      "tyre": "HARD",
      "stint_duration_laps": 34,
      "lap_time_seconds": 83.317,
      "lap_time": "1:23.317",
      "lap_time_or_gap": "+15.519s"
    }
    ...
  ],
  "fastest_lap": {
	"driver_number": 3,
	"lap_number": 42,
	"duration_seconds": 82.091,
	"duration_formatted": "1:22.091",
	"driver_name": "Max VERSTAPPEN",
	"driver_name_acronym": "VER",
	"team_colour": "4781D7"
  }
}
Flat. Ordered by position. Every field the display needs, nothing it doesn't. That's the contract, the ESP32 never sees a raw OpenF1 response.
Part 2: The Display
The part you actually look at. The CYD runs Micro Python with an ILI9341: fill_rectangle, fill_circle, draw_text8x8.
The font is fixed 8×8, no sizing, no wrapping. Every element is placed by hand with explicit coordinates. At 320×240, every pixel is intentional. That's the design challenge.
Layout
- Top bar (22px): circuit, lap, SC badge when active
- Bottom bar (20px): fastest lap in purple, lap number
- Rows (198px): 19px per row → 10 drivers on screen (top 10)
Column x-coordinates are constants; team colours from the API are hex, so convert once to RGB565 per driver and cache it, the ILI9341 needs 16-bit values.
# ── DISPLAY RENDERING ─────────────────────────────────────
# Uses ili9341: fill_rectangle, fill_circle, draw_text8x8 (8x8 built-in font)

ROW_H    = 19
TOP_BAR  = 22
BOT_BAR  = 20
MAX_ROWS = 10  # (240 - 22 - 20) / 19 = 10 rows, order by position

# Column x positions (more spacing between position, driver #, strip, name, tyre, stint, lap time, gap)
COL_POS = 5
COL_DRIVER_NUM = 30
COL_STRIP = 50
COL_CODE = 60
COL_TYRE = 105
COL_STINT = 125
COL_LAP_TIME = 160
COL_GAP = 250
TOP_BAR_LAP_X = 265
Every element is placed by these constants, like position, driver number, team strip, code, tyre circle, stint laps, lap time and gap. Change one and you touch every draw_text8x8 and fill_rectangle that uses it.
Rendering
- Top bar: red strip, circuit left, lap right, yellow SC badge when the latest
/race_controlmessage says safety car. - Driver rows: alternating black/dark grey background; team colour on number and 3px strip; driver code; tyre as circle with compound initial (S/M/H/I); stint laps; lap time or gap (P1 gets their lap time, everyone else gets
lap_time_or_gapfrom the aggregator, including"+1 LAP"for lapped drivers). - Bottom bar: FL driver and time in purple, lap number in grey.
The 8×8 font caps line length (e.g. 9 chars for the gap column); the aggregator already sends formatted strings so the client never does number formatting.
Mapping the response: parse_pitwall
The renderer expects four dicts keyed by driver number, positions, drivers, laps, stints, because each draw function takes a driver key and looks up what it needs.
The API returns a single list of standings rows. parse_pitwall() is the bridge: one pass over current_standings, fan out each row into the four dicts, add session metadata and fastest-lap fields for the bars.
If the aggregator changes its response shape, you update this one function and the render calls stay unchanged.
This article is for subscribers only
To continue reading this article, just register your email and we will send you access.
Subscribe NowAlready have an account? Sign In