I Installed Free-Threaded Python - The GIL Came Back Anyway
Python 3.14 made the free-threaded build officially supported. Nice change log line.
I installed 3.14t the way I install anything I'm excited about, way too fast, and with one bad assumption: that the build was enough.
python -VV said free-threading build. I spun up threads on a CPU-bound job and waited for the cores to light up. Wall time barely moved. Four threads, one core's worth of progress.
Nothing crashed. Nothing warned.
My threads didn't fail, they went back to taking turns. A C extension I'd imported wasn't ready, so the runtime quietly put the GIL back on.
I only knew because I finally asked sys._is_gil_enabled().
That afternoon is why I wrote this down.
Why I cared
For twenty years I lived with the same rule everyone else did. The global interpreter lock means only one thread runs Python byte code at a time. Threads were fine when I was waiting on sockets. Useless when I wanted CPU. Need cores? Pay for processes.
Python 3.13 shipped a free-threaded build as an experiment. Python 3.14 made it officially supported, although still optional, still not the default.
Most people who install 3.14 still get the GIL. I wanted a narrower answer: if I install the other build, what actually gets faster, and what quietly puts the lock back?
So I set up a small lab experiment with uv, a stdlib-only benchmark, and one unmarked C extension.
Setting up the lab
Free-threading isn't a flag on normal 3.14. It's a separate interpreter: python3.14t.
With uv I ask for 3.14t, pin it in the project, and keep requires-python = ">=3.14" in pyproject.toml, the t is a build variant, not a version number, and uv will refuse >=3.14t.
$ uv python install 3.14 3.14t
Installed 2 versions in 2.32s
+ cpython-3.14.5+freethreaded-linux-x86_64-gnu (python3.14t)
+ cpython-3.14.5-linux-x86_64-gnu (python3.14)
$ uv python pin 3.14t
Pinned `.python-version` to `3.14+freethreaded`
When I want the normal GIL build back for a comparison, I ask for it by name. A pinned 3.14t plus an existing .venv will swallow a vague --python 3.14, and I'll think I'm comparing when I'm not.
uv run --no-project --isolated --python 3.14+gil python benchmark.py
uv run --no-project --isolated --python 3.14t python benchmark.py
What I measured
I kept the first benchmark pure Python on purpose: format a row, split it, fold integers.
Same total work, one thread then four.
Libraries that drop the lock from C would fake a win on the default build, and I'd be measuring the wrong thing.
from concurrent.futures import ThreadPoolExecutor
import time
def crunch(n: int) -> int:
acc = 0
for i in range(n):
a, b, c = f"{i},{i * i},{i % 97}".split(",")
acc += int(a) + int(b) + int(c)
acc ^= acc << 1
acc &= 0xFFFFFFFF
return acc
def wall_time(workers: int, total: int) -> float:
chunk, rem = divmod(total, workers)
sizes = [chunk + (1 if i < rem else 0) for i in range(workers)]
started = time.perf_counter()
with ThreadPoolExecutor(max_workers=workers) as pool:
list(pool.map(crunch, sizes))
return time.perf_counter() - started
The full script in the lab repo prints interpreter metadata, repeats the run, and keeps the best wall time.
Let's now run the benchmark:
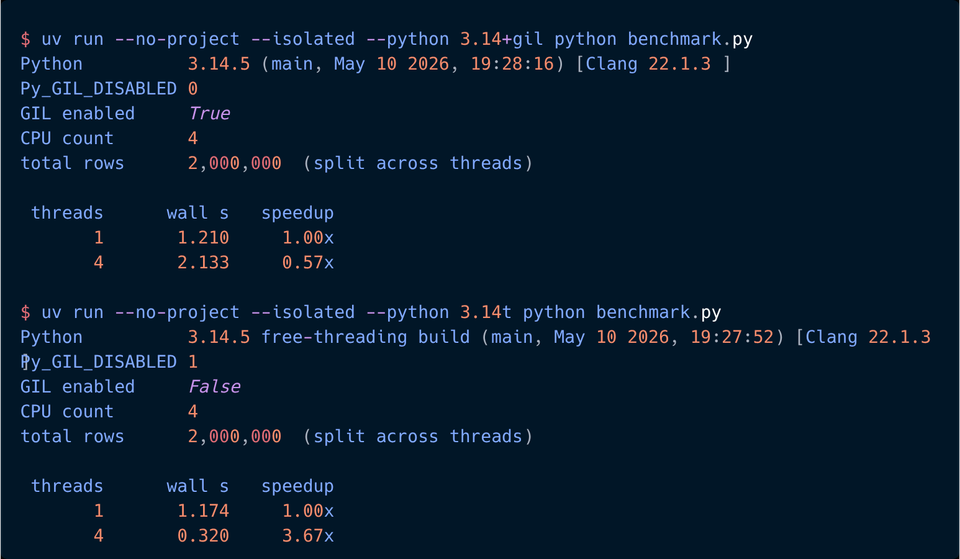
$ uv run --no-project --isolated --python 3.14+gil python benchmark.py
Python 3.14.5 (main, May 10 2026, 19:28:16) [Clang 22.1.3 ]
Py_GIL_DISABLED 0
GIL enabled True
CPU count 4
total rows 2,000,000 (split across threads)
threads wall s speedup
1 1.210 1.00x
4 2.133 0.57x
$ uv run --no-project --isolated --python 3.14t python benchmark.py
Python 3.14.5 free-threading build (main, May 10 2026, 19:27:52) [Clang 22.1.3 ]
Py_GIL_DISABLED 1
GIL enabled False
CPU count 4
total rows 2,000,000 (split across threads)
threads wall s speedup
1 1.174 1.00x
4 0.320 3.67x
Default 3.14: four threads were slower than one (0.57×). Contention for the lock, not a free lunch. 3.14t: about 3.7× on four cores.
That speedup is the clean-lab ceiling, not a promise. This job shares nothing: no shared dict, no dataframe, no lock.
Contention and native code that still serializes will pull real work toward 2×. If I see 1.1×, I'm paying a single-thread tax (often a few percent, sometimes closer to 10%) for nothing.
But the reason I still don't trust a fresh 3.14t pin isn't bad scaling. It's quieter than that.
The thing that ate my afternoon
The build can say free-threaded and still be running with the GIL on. python -VV and a compile-time flag only tell me which interpreter I installed. sys._is_gil_enabled() tells me what's happening right now.
import sys
import sysconfig
sysconfig.get_config_var("Py_GIL_DISABLED") # 1 on a free-threaded build
sys._is_gil_enabled() # False — until something flips it
I need both. That's how I burned the afternoon.
Import a C extension that hasn't said it can run without the GIL, and the interpreter turns the lock back on for the rest of the process. It prints a warning. It doesn't raise.
The benchmark keeps running. The threads keep looking busy. Throughput goes back to taking turns.
The detector I use is a loop:
import importlib, sys, warnings
print("before", sys._is_gil_enabled()) # False on a fresh 3.14t
for name in ["numpy", "pandas", "gil_trap"]:
with warnings.catch_warnings(record=True) as caught:
warnings.simplefilter("always")
importlib.import_module(name)
print(name, sys._is_gil_enabled())
for w in caught:
if "gil" in str(w.message).lower():
print(" ", w.message)
I start free-threaded. Import dependencies one by one. Watch for the flip.
The lab at python-threads-gil-article ships trap/: a tiny C extension that does no work and never declares itself safe. That's enough.
$ uv run --no-project --isolated --python 3.14t --with ./trap python gil_detector.py gil_trap
Built gil-trap @ file:///.../python-threads-gil-article/trap
Installed 1 package in 0.79ms
Python 3.14.5 free-threading build (main, May 10 2026, 19:27:52) [Clang 22.1.3 ]
Py_GIL_DISABLED 1
before imports gil_enabled=False
gil_trap gil_enabled=True <-- GIL re-enabled
warning: The global interpreter lock (GIL) has been enabled to load module 'gil_trap', which has not declared that it can run safely without the GIL. To override this behavior and keep the GIL disabled (at your own risk), run with PYTHON_GIL=0 or -Xgil=0.
after all imports gil_enabled=True
PYTHON_GIL=0 after that warning is not a fix. It's a dare. The module told me it isn't safe. I should believe it.
I re-ran the benchmark after importing gil_trap. The 3.7× was gone: back to taking turns, same story as default 3.14.
What about the stack I already run? On this machine, current NumPy, pandas, SciPy, Pydantic, and FastAPI imported clean: lock still off after each.
Having a free-threaded wheel isn't the same as scaling under threads either. Some paths still take their own locks. Async and I/O don't care much: the GIL was never what made await work.
The thing that worried me was the private wheel, the pinned 18-month-old native module, the "works on 3.14" package that only shipped the normal build. I look for the t in the package tag and keep an eye on py-free-threading and free-threaded wheels.
Where I landed
I stay on default 3.14 when the work is mostly waiting: sockets, databases, HTTP. Async already overlaps that. Free-threading won't make FastAPI handlers magically use four cores while they talk to Postgres.
I stay off it for single-threaded CLIs too. A little slower, no parallelism, nothing to show for the pin. And if the hot path is a native library that still serializes, or a wheel that re-enables the GIL, I'd just be paying a tax to keep the lock.
I still reach for processes when isolation matters more than shared memory: crash domains, messy native code.
I reach for 3.14t when the work is CPU-bound Python that already shares memory awkwardly across processes: parallel transforms, image or PDF pipelines, batch work over local files.
And only when I control the dependency set: a greenfield worker or a small internal tool, not the forty-wheel monolith I inherited. Before I trust threads on that build, I run the detector on a cold start, and in CI, after every import that matters.
Free-threading in 3.14 is real. On my lab box, four threads finished that CPU job in about a third of the time. It's also a different interpreter and a dependency veto. One unmarked native module and I'm back to one core, with a warning that looks like noise.
Try the lab on your hottest CPU path. Then tell me what broke.
Follow me on Twitter: https://twitter.com/DevAsService
Follow me on Instagram: https://www.instagram.com/devasservice/
Follow me on TikTok: https://www.tiktok.com/@devasservice
Follow me on YouTube: https://www.youtube.com/@DevAsService
Comments ()